<img height="1" width="1" src="https://www.facebook.com/tr?id=113643043990058&amp;ev=PageView%20&amp;noscript=1">


2013 National Survey of Renters

A new national survey of renters by Opinion Research Corporation dispels myths and answers questions about the future viability of millions of single-family homes owned by real estate investors.


Is Renting a Single-Family Home the New Alternative to Homeownership?

A new national survey of renters by Opinion Research Corporation dispels myths and answers questions about the future viability of millions of single-family homes owned by real estate investors.

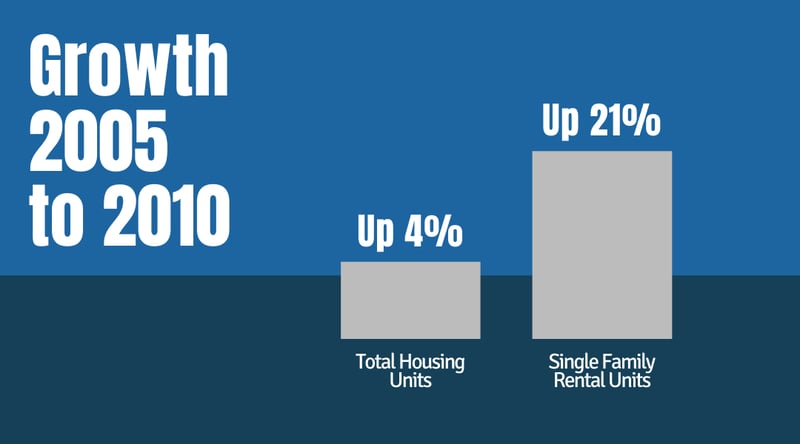
    • Is there a stable demand for the growing number of foreclosures converted into rentals? 
    • Which renters are more stable and likely to stay five years or more, single-family? 
    • Which are more eager to become homeowners? 
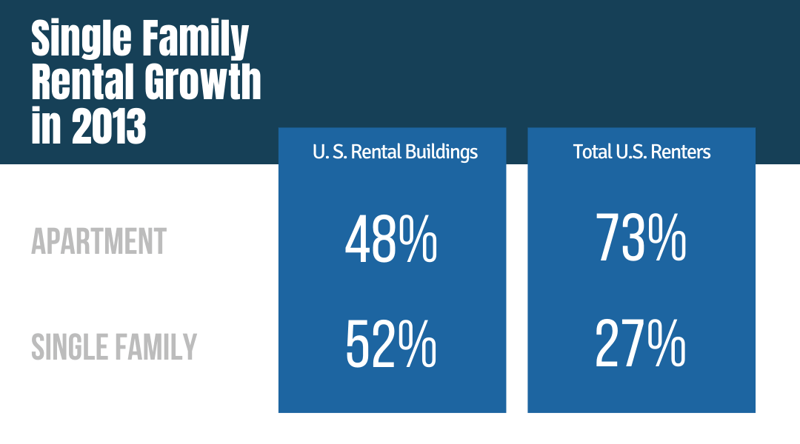
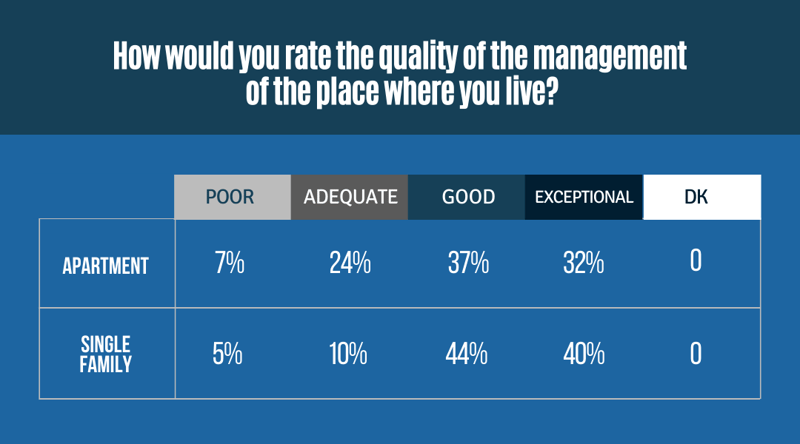
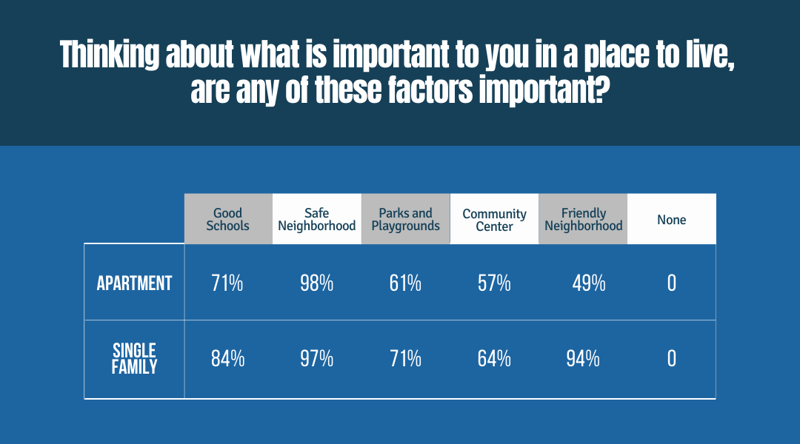
    • How are SFR tenants different from apartment dwellers?


The Single-Family Rental Solution

Single-family rental homes are the fastest-growing housing option in America. Some 52 percent of all rental units in the U.S. are single-family homes, housing 27 percent of all renters.i Most, 3.60 million, were originally built for owner occupancy but passed into the ranks of rentals when their owners lost them through foreclosure.

From the peak of the housing boom in 2005 to 2010, single-family rentals grew at 21 percent versus just a 4 percent increase in total housing units, according to Census data.ii


Single Family Rental Growth in 2013


Last year, demand was so strong it took just 2.6 months to rent the available stock of single-family rentals available last summer, down from 3.2 months of supply last year and over 5 months in 2007. It took just six weeks for a listing to be rented last fall, compared to more than eight weeks in 2009. Single-family rents rose by 2 percent in 2011 and have increased by 1 percent through the first half of 2012 after declining in 2009 and 2010. Sam Khater, senior economist at CoreLogic, a leading expert on the single-family category expects rent growth to increase “at a strong clip” throughout 2013, though not at the same rate as home prices. iii

Strong demand for apartments is expected to drive up rents 4.6 percent this year according to the National Association of Realtors and more than 4 percent a year for 2014 and 2015, according to Reis. Five to six million new renter households may be created within the next 10 years, likely caused by low inventories of homes available and tight credit conditions, according to the Bipartisan Policy Center.


Growth 2005 to 2010


In light of their fast rise, many questions remain about the long-term prospect for single-family rentals.

With more than a million homes still in the national foreclosure inventory, more owner-occupied homes will be converted to rentals in the coming years.


Anticipated Increase in Rents for 2013


Will rental demand be adequate to sustain so many? As the recovery sets in and household formation picks up, will young families transition to homeownership and leave the ranks of renters?

Will rentals return to owner occupancy to meet the demand? Or will single-family rentals carve out a permanent place for themselves in America’s housing pantheon, appealing to families and individuals who want the flexibility of renting plus the space, security, and sense of community of living in a house? What will the future hold for millions of individual investors and the well-financed private equity funds that have invested billions in the REO-to-rental business?

Though single‐family rentals probably existed long before multi-family, relatively little is known about the single‐family tenant today. This survey of both single-family and multi-family tenants explores basic issues important to understanding the demand for both rental options.


Months to Turnk National SFR Inventory


Key Findings


How long do you plan to live in your current home  Anticipate becoming a homeowner in five years  Why wont you become a homeowner in next five years


More Single-Family Than Apartment Renters Likely to Stay-In-Place

Single-family home tenants are 25 percent more likely than apartment tenants to stay in their current homes five years or longer, suggesting that demand for single-family homes, the fastest-growing rental category, will be more stable than multi-family demand.

One out of four (26%) single-family tenant plans to stay in place five years or more, compared to one out of five apartment dwellers (22%).


How would you rate the quality of the management of the place where you live


Strong Ratings for Single-Family Rental Property Management

One factor contributing to single-family stability could be high marks renters give the quality of single- family property management. Some 84 percent of tenants in single-family rentals said their property management was good or exceptional compared to 69 percent of apartment renters. One out of four apartment dwellers (26%) rated their management as only adequate.


Half of Renters Plan to Buy

Half of all renters (52%), including 60 percent of single‐family renters and 44 percent of apartment dwellers, said they anticipate becoming homeowners in the next five years. Families with three or more members (64%) and children under 13 (69%) were more likely to become homeowners than the 43 percent who don’t plan to become owners.

The near term interest in becoming homeowners among single-family tenants reflects the new roles single-family rentals are fulfilling as a stepping stone to homeownership for first‐time buyers and as a sanctuary for large numbers of families displaced by foreclosures but who plan to buy again when they can afford to do so.


Rental Lifestyle, Not Financing, Keeps Renters from Homeownership

Despite reports that difficulties getting financing are keeping many renters from becoming homeowners, the survey found that the inability to get a mortgage ranks only third of among the reasons renters don’t plan to become homeowners. Among those who do not anticipate becoming homeowners (43 percent of all renters), 29 percent say they can’t get a mortgage. More renters report that they don’t want to buy a home because they enjoy being renters (40%) or they simply don’t want to be homeowners (39%).

Short-term turnover rates for both multi-family and single-family rentals over the next two years are typical for both multi-family (56%) and single-family homes (59%). Apartments typically experience an annual 50 to 60 percent tenant turnover.


Thinking about what is important to you in a place to live, are any of these factors important


Single Family Tenants Are Wealthier, Older, Value Schools And Parks

Single-family renters make more money and are nearly twice as likely to have children as apartment dwellers. Median income for a single-family renter is $75-100,000 (66%) versus $50,000-75000 (51%) for a multi-family tenant. Single-family households are larger; some 65 percent have three or more members compared to 32 percent of apartment households. Some 63 percent of single-family households include children; only 34 percent of apartment renters have children living with them.

Most single-family tenants are older, aged 35-44 (53%) compared to 14-34 (46%) and 65+ (61%) for apartment dwellers.

Compared to apartment dwellers, single-family renters value neighborhood features important to children, such as parks and playgrounds (65% to 71%), good schools (72% to 82%) and safe neighborhoods (97% to 98%).


Survey Design: Single-Family Vs. Multi-Family

Even today, when single-family units outnumber multi-family, virtually all market research is conducted with the multi-family segment. Research on critical issues like future housing plans, tenure, attitudes towards management, expectations of homeownership, and reasons for renting almost always reflect attitudes of multi-family, not single-family, tenants. Our knowledge of the single-family rental tenant is often anecdotal, yet their attitudes could determine the future viability of single-family renting.

The survey identified multi-family and single-family renters and asked each group identical questions. Results for each question can be compared and by rental type, demographic factors and other questions found in the survey.

The telephone survey was conducted amongst two national probability samples, which, when combined, consists of 1,006 adults, 505 men and 501 women 18 years of age and older, living in the continental United States. Interviewing for this CARAVAN® Survey was completed on January 10-13, 2013. 656 interviews were from the landline sample and 350 interviews from the cell phone sample.


Methodology

All CARAVAN® interviews are conducted using ORC International’s (ORC) computer-assisted telephone interviewing (CATI) system.

As required by the Code of Standards of the Council of American Survey Research Organizations (CASRO), we will maintain the anonymity of our respondents. No information will be released that in any way will reveal the identity of a respondent.


SAMPLING

The CARAVAN® landline-cell combined sample is a dual-frame sampling design. This means that the sample is drawn from two independent non-overlapping sample frames—one for landlines and one for cell phones.


LANDLINE SAMPLE

ORC’s Random Digit Dial (RDD) telephone sample is generated using a list-assisted methodology. That is the updated white page listings that are used to identify telephone number banks (the first 8 digits of the phone number) with a listed phone number in them. The standard that we use is 2+, meaning that a bank needs to have 2 or more listed households to be considered working. We use the Genesys Sampling in-house system to generate a list-assisted Random Digit Dialing sample.

The standard GENESYS RDD methodology produces a strict single-stage, EPSEM (Equal Opportunity of Selection Method) sample of residential telephone numbers. In other words, a GENESYS RDD sample ensures an equal and known probability of selection for every residential telephone number in the sample frame.


CELL PHONE SAMPLE

The MSG Cellular RDD database is constructed quarterly utilizing Telecordia’s LERG product. The LERG is a continuously updated suite of telephony databases that, among other things, provides current information for every active Thousand Series Block in the North American Numbering Plan. Using multiple files within the LERG, every thousand series block that is dedicated to providing wireless service is identified and incorporated into the Cellular RDD database. Additionally, switch locations for the selected thousand series blocks are determined. This provides the information needed to map each cellular thousand series block to a county.

The cell phone sample was generated from cell phone only 1,000 series blocks with all the 100 series banks within each block turned on. The sampling interval is then calculated by dividing the universe of all possible numbers by the number of records desired, thus specifying the size of the frame subdivisions.

At this point, the frame size has been fixed and divided into equal-sized subsets of ten-digit numbers. Within each of the subsets one number is selected at random giving all numbers an equal probability of selection.


WEIGHTING

In probability-based samples such as CARAVAN®, the basis of the weighting is the inverse of the selection probability. Then, weighting adjustments are frequently used to reduce the potential for biases that may be present due to incomplete frame coverage and survey nonresponse--both inherent in all telephone surveys. These adjustments may take advantage of geographic, demographic, and socioeconomic information that are known for the population as well as measured in the sample surveys. The adjustments reduce potential bias to the extent that the survey respondents and nonrespondents (noncontacts, refusals, etc.) with similar geographic, demographic, and socioeconomic characteristics are also similar with respect to the survey statistics of interest. In other words, post- survey weighting adjustments reduce bias if the weighting variables are related to (correlated with) the survey measures and the likelihood of survey participation.

For CARAVAN® (landline), the post survey weighting adjustments leverage population-based estimates as reported by the Current Population Survey (CPS). This form of weighting is referred to as calibration weighting in that survey respondents are assigned weights that are calibrated to reflect the population. The calibration weighting for CARAVAN® is based on an iterative series of ratio adjustments callediterative proportional fitting, or raking , which was first introduced by Deming and Stephan for use in the 1940 US census. For CARAVAN®, the ratio adjustments calibrate the survey data to the population for age, sex, race/Hispanic origin, Census region, and education.


About Premier Property Management Group

Premier Property Management Group was formed in Memphis, Tennessee by the Clothier family in 2009 and has grown to manage assets in value exceeding $150 million and consisting of 1,700 properties in two Top 20 U.S. Cities. The purpose of founding Premier Property Management Company was to replace the below-average property management options for real estate investors buying an investment property in Memphis, Tennessee, and Dallas, Texas. High-quality property management companies providing exceptional customer service simply did not exist. Starting from the ground up, the management company has grown into a leader in developing processes and systems for providing outstanding customer service, seamless accountability, and transparent communication. Premier Property Management Group also mentors new property management companies and entrepreneurs entering the property management field.


About REI Nation and Dallas Invest

Both companies were formed to offer real estate investors a passive investment opportunity in two of the Top U.S. markets for property investment environment and metrics. Premier Property Management Group offers management services to the clients of each company along with other real estate investors. Serving over 670 clients worldwide, REI Nation and Dallas Invest complete over 400 property acquisitions, renovations and long-term rental placements each year and Premier Property Management Group is on pace to have $250 million in assets under management by July 1, 2014.