<img height="1" width="1" src="https://www.facebook.com/tr?id=113643043990058&amp;ev=PageView%20&amp;noscript=1">


2012 Survey of Real Estate Investors

A joint survey from BiggerPockets.com and REI Nation polled residential real estate investors across America to reveal national sentiments toward real estate investments


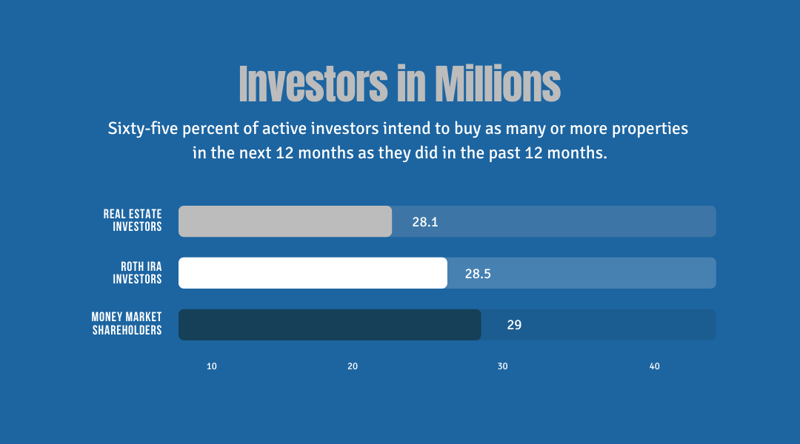
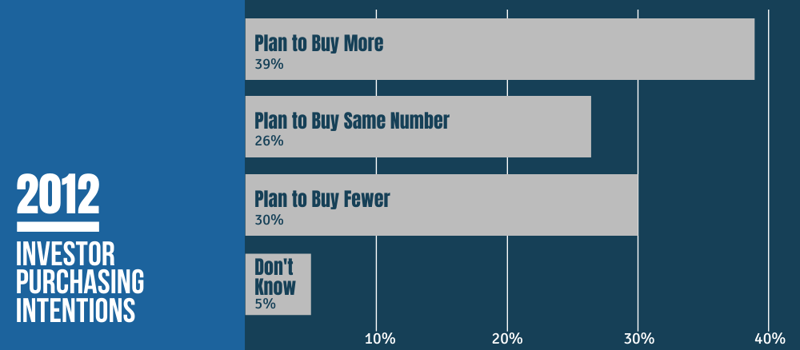
Investors Plan To Buy As Many Or More Residential Properties In The Next 12 Months

Despite rising prices and shrinking foreclosure inventories, most active real estate investors plan to buy as many or more residential properties in the next 12 months as they did in the past year.

America’s housing crisis generated nearly 4 million foreclosures and devastated residential equity for more than six years, but it also created a powerful new positive force in the nation’s residential real estate economy. Large numbers of individuals and small partnerships saw opportunities to profit from depressed prices and began investing in foreclosures and short sales, buying them at a discount and renovating them, either to sell at a profit or to rent out, often to families that had lost their homes to default. Investors accounted for as many as 25.3 percent of all home sales by May 2012. i

Investors played a critical role in the stabilization of local real estate markets ravaged by foreclosures. When few other buyers would take the risk, investors bought up foreclosures in local markets, restored buyer confidence and began the process of price stabilization, first in shattered Florida markets and then in the Western markets like Phoenix and Las Vegas. Investor-owned homes have established single-family rentals as a 100 billion dollar business and single-family rentals have become so numerous that today they outnumber apartments. ii

The investment potential of foreclosures and short sales now is attracting billion-dollar investments by well-financed partnerships and corporations. Plans are underway to create a new secondary market in securities backed by cash flows from single-family rentals. iii

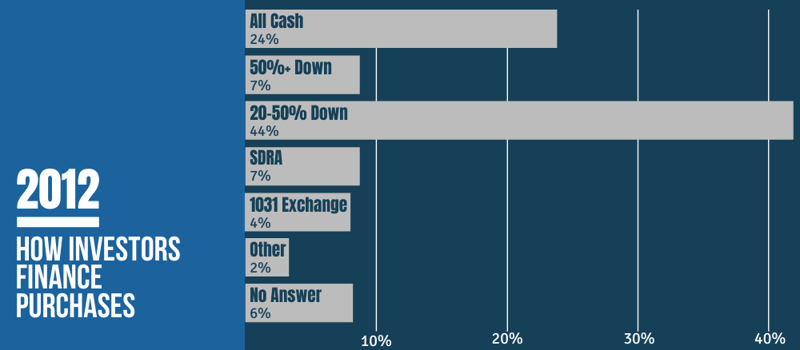
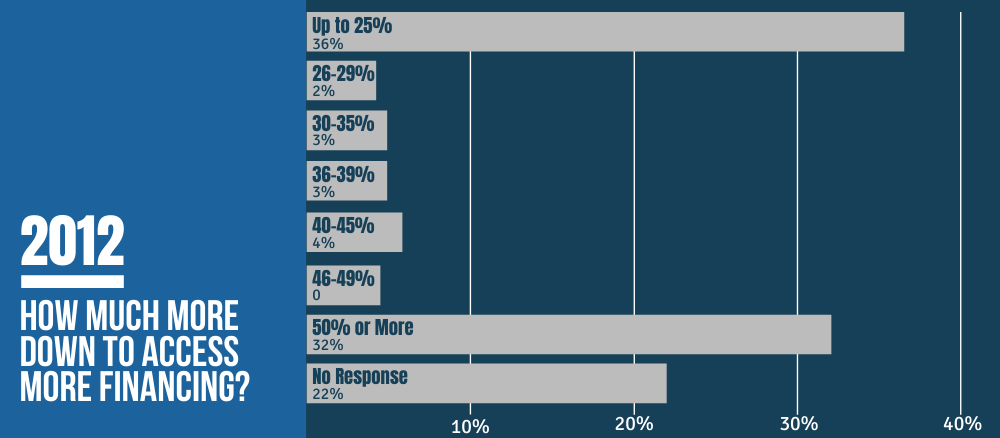
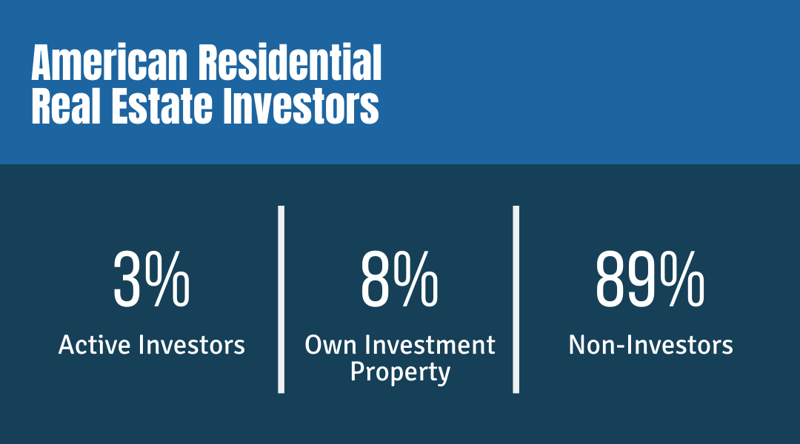
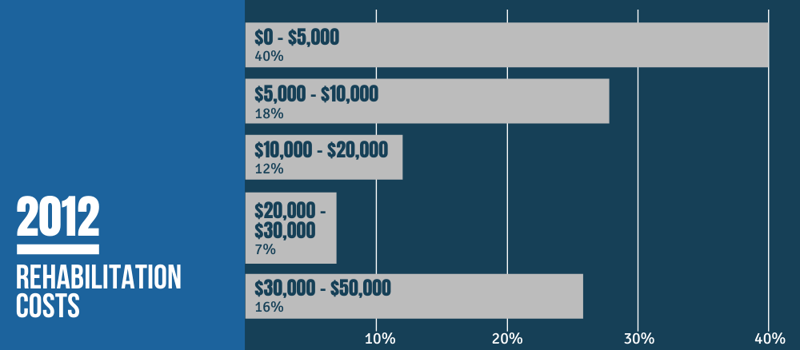
Despite their marketplace impact, little is known about these residential real estate investors. How many are there? How many actively buy and sell properties continuously and how many are more passive, managing one or two at a time? How much do they spend to repair the housing stock damaged by foreclosures that take a year or more to process? How are they financing their transactions and what restrictions limit their activity?

As distress sales decline and prices improve, iv some are questioning the future role of investors. v Will their role diminish or will investors adapt to changing market conditions and continue to augment demand?

To help answer these and other questions, and to validate the role real estate investors are playing in the housing recovery, BiggerPockets.com, the nation’s largest and most active real estate investing social network, and REI Nation, one of the nation's leading providers of single-family rental real estate investment services, joined forces to sponsor a national survey on investor s and their near-term intentions.

ORC International, the leading global market research firm founded in 1938 that conducts the CNN|ORC International poll conducted the Real Estate Investment Realities survey. ORC’s CARAVAN Omnibus used both landline and mobile telephones on August 9-12/16-19/23-26, 2012 among 3036 adults , 1,515 men and 1,521 women 18 years of age and older, living in the continental United States. Some 2,285 interviews were from the landline sample and 751 interviews from the cell phone sample. The margin of error for the survey is +/-03%. All CARAVAN® interviews are conducted using ORC International’s computer assisted telephone interviewing system.


One Out Of Eight American Adults Is A Residential Real Estate Investor

Some 3 percent of American adults, or 7 million people, consider themselves to be real estate investors and they will be actively buying a property with the next 12 months. An additional 9 percent own an investment property but have no current plans to buy more. Thus, one out of eight, or 28.1 million, Americans either consider themselves residential real estate investors or own residential investment properties today.

The number of residential real estate investors today, according to the survey, is about the same as the number of Americans who own Roth IRAs (28.5 million) vi or the total number of money market fund shareholders (29 million). vii

The 7 million active investors are evenly split between those who make more than five purchases a year and those who make fewer. Most active investors are under 55 years old (76 percent) and they are more likely to live in the South or West (66 percent). More than a third (34 percent) of active investors make more than $75,000 a year. Thirty-seven percent have a high school degree or less.


American Residential Real Estate Investors


Investors in Millions

Sixty-five percent of active investors intend to buy as many or more properties in the next 12 months as they did in the past 12 months.


Investors in Millions


Investor Purchasing Intentions

Despite rising prices and declining investor market share in many markets at the time that the survey was conducted during August 2012, viii some 39 percent of active investors intend to increase their purchases over the next twelve months and 26 percent plan to buy as many in the year to come as they did in the past year. Only 30 percent said they plan to buy fewer properties.

These aggressive plans signal investor confidence that rents will continue to be strong, and that prices will continue to rise and that properties purchased today will appreciate. They also suggest that investors will play as great or a greater role in the recovery of local real estate markets in the months to come than they have in the past. In 2011, single-family and condo purchases for investment rose 64.5 percent from 2010 and totaled 1.23 million properties, compared to 749,000 in 2010, or about 30 percent of all existing homes sold last year. ix

Among investors who plan to buy more next year, most (54 percent) are between the ages of 35 and 55. Thirty-six percent of investors planning to buy more properties next year earn over $100,000 a year. Fifty-five percent are college graduates.

Investors spend $7500 repairing and rehabilitating each property they buy.


2012 Investor Purchasing Intentions


Rehabilitation Cost

Investors plan to spend a median of $7500 apiece to repair and rehabilitate their next purchases. Some 20 percent plan to spend even more, $10,000 to $30,000, on their next property, and 16 percent plan to spend even more than that, $30,000 or more.

In 2011, investors purchased 1.23 million homes a 64.5 percent increase over 749,000 in 2010. x During the first two quarters of this year, the investor share of monthly existing home purchases has remained in the 26 to 20 percent range. As total sales have risen, 2012 investor purchases should approximate or even exceed purchases in 2011.

At a median expenditure of $7500 per property, investors are thus spending a total of $9.2 billion per year to repair the damage caused by foreclosures and rehabilitate the nation’s housing stock.

At that rate, investors are spending more on restoring the housing stock than the federal government. In 2008, Congress approved the Neighborhood Stabilization Program to restore properties damaged by foreclosure. Its total budget to date is only $7 billion. xi Investors are spending more each year than the government has spent in four years.

Lower interest rates would increase investor activity more than any other incentive.

Mortgage interest rates are at record levels, but the commercial and small business loans typically available to individuals and smaller real estate investors are considerably more expensive.

Several factors contribute to establishing the interest rates: credit history, the loan-to-value (LTV) of the property, market conditions, and loan type and terms. Current rates for loans to buy residential properties range from 4.5 percent to 7 percent. xii

Lower interest rates topped the list of incentives that would make active investors more willing to invest in additional properties (70 percent). A distant second was additional tax incentives for capital spent to purchase, rehab or renovate investment properties (54 percent). Third place went to the elimination of limits imposed by lenders on the amount they will lend an investor (46 percent) and fourth to easing of rules on section 1031 Exchanges (44 percent). Only 30 percent said that the easing of securities laws limiting the pooling of capital by investors for purchases would encourage them to buy more.


2012 Rehabilitation Costs


Investor Incentives

Only one in four investors (24 percent) uses all cash. Over half (51 percent) use financing.

The impression that all real estate investors use all cash for their purchases is certainly not true. In fact, only one in four plans to pays all cash for their next purchase. Slightly more than half (51%) put down a percentage of the purchase price and finance the balance. About 12 percent acquire properties as exchanges under Section 1031 of the Internal Revenue Code, which allows them to defer capital gains. Four percent use a self-directed retirement account.

Forty-four percent of all investors use financing and put 20 to 50 percent down. Only 7 percent put down more than 50 percent.

Younger investors under 55 are more likely to use financing (82 percent) than older investors and those with incomes over $100,000 are more likely to use all cash.


2012 Investor Incentives
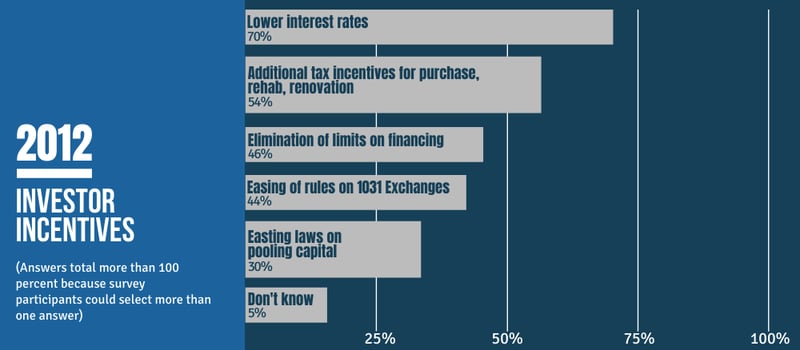
(Answers total more than 100 percent because survey
participants could select more than one answer)


How Investors Finance Purchases

Nearly half of investors would put down more than 25 percent to access financing without limits.

Access to financing is a critical issue for most investors, however, most lenders put limits on the amount they will lend an investor, regardless of credit history, property values or track record. Nearly half, 44 percent, would be willing to put down more than 25 percent on a business loan in order to be able to borrow more from a lender, without limits.

Nearly one out of three investors, 32 percent, said they are willing to put down more than 50 percent of the value of the loan if there were no limits placed on the amount they could borrow from a lender to buy more properties.


2012 How Investors Finance Purchases


How Much More Down To Access More Financing

2012 How Much More Down to Access More Financing


Methodology

This report presents the findings of three telephone survey conducted among two national probability samples, which, when combined, consists of 3,036 adults, 1,515 men and 1,521 women 18 years of age and older, living in the continental United States. Interviewing for these CARAVAN® Surveys was completed on August 9-12, 16-19, and 23-26, 2012. Some 2,285 interviews were from the landline sample and 751 interviews from the cell phone sample.

All CARAVAN® interviews are conducted using ORC International’s (ORC) computer-assisted telephone interviewing (CATI) system.

As required by the Code of Standards of the Council of American Survey Research Organizations (CASRO), we will maintain the anonymity of our respondents. No information will be released that in any way will reveal the identity of a respondent.

Sampling
The CARAVAN® landline-cell combined sample is a dual-frame sampling design. This means that the sample is drawn from two independent non-overlapping sample frames—one for landlines and one for cell phones.

LandLine Sample 
ORC’s Random Digit Dial (RDD) telephone sample is generated using a list-assisted methodology. That is the updated white page listings that are used to identify telephone number banks (the first 8 digits of the phone number) with a listed phone number in them. The standard that we use is 2+, meaning that a bank needs to have 2 or more listed households to be considered working. We use the Genesys Sampling in- house system to generate a list-assisted Random Digit Dialing sample.

The standard GENESYS RDD methodology produces a strict single-stage, EPSEM (Equal Opportunity of Selection Method) sample of residential telephone numbers. In other words, a GENESYS RDD sample ensures an equal and known probability of selection for every residential telephone number in the sample frame.

Cell Phone Sample 
The MSG Cellular RDD database is constructed quarterly utilizing Telecordia’s LERG product. The LERG is a continuously updated suite of telephony databases that, among other things, provides current information for every active Thousand Series Block in the North American Numbering Plan. Using multiple files within the LERG, every thousand series block that is dedicated to providing wireless service is identified and incorporated into the Cellular RDD database. Additionally, switch locations for the selected thousand series blocks are determined. This provides the information needed to map each cellular thousand series block to a county.

The cell phone sample was generated from cell phone only 1,000 series blocks with all the 100 series banks within each block turned on. The sampling interval is then calculated by dividing the universe of all possible numbers by the number of records desired, thus specifying the size of the frame subdivisions.

At this point, the frame size has been fixed and divided into equal-sized subsets of ten-digit numbers. Within each of the subsets, one number is selected at random giving all numbers an equal probability of selection.

Weighting
In probability-based samples such as CARAVAN®, the basis of the weighting is the inverse of the selection probability. Then, weighting adjustments are frequently used to reduce the potential for biases that may be present due to incomplete frame coverage and survey nonresponse--both inherent in all telephone surveys. These adjustments may take advantage of geographic, demographic, and socioeconomic information that is known for the population as well as measured in the sample surveys. The adjustments reduce potential bias to the extent that the survey respondents and nonrespondents (noncontact, refusals, etc.) with similar geographic, demographic, and socioeconomic characteristics are also similar with respect to the survey statistics of interest. In other words, post-survey weighting adjustments reduce bias if the weighting variables are related to (correlated with) the survey measures and the likelihood of survey participation.

For CARAVAN® (landline), the post survey weighting adjustments leverage population- based estimates as reported by the Current Population Survey (CPS). This form of weighting is referred to as calibration weighting in that survey respondents are assigned weights that are calibrated to reflect the population. The calibration weighting for CARAVAN® is based on an iterative series of ratio adjustments called iterative proportional fitting, or raking , which was first introduced by Deming and Stephan for use in the 1940 US census. For CARAVAN®, the ratio adjustments calibrate the survey data to the population for age, sex, race/Hispanic origin, Census region, and education.

The CARAVAN® landline-cell combined sample is a dual frame sampling design. This means that the sample is drawn from two independent sampling frames—one for landlines and one for cell phones. Adults with a landline but no cell phone (A) must be reached through a landline telephone sample. Adults with a cell phone and no landline (C) must be reached through the cell phone sample. Adults with both a landline and a cell phone (B) can be reached through either of the frames. Sampling from the two frames results in these four groups:

a1: Landline respondents without a cell phone (landline only) 
b1: Landline respondents with a cell phone (dual user) 
b2: Cell phone respondents with a landline (dual user) 
c2: Cell phone respondents without a landline (cell only)

The dual user groups (b1, b2) are further classified into three subgroups:

Landline mostly: those who receive most calls on a landline,
True dual: those who receive calls on both regularly,
and Cell mostly: those who receive most calls on a cell phone.

Finally, the combined sample is weighted to represent the US population using data from the Current Population Survey (CPS) on age, gender, race, region, and education as noted above.


About REI Nation

REI Nation provides single-family rental real estate investment services to domestic and international clients looking to include residential real estate ownership in their investment portfolios. Founded in 2004, the company is a full-service investment company that provides all of the essential services for an investor from acquisition, renovation, rental and on-going property management for individuals looking to build their real estate investment portfolio. A privately held, family-owned business based in Memphis, Tenn., the company is led by three generations of the Clothier family. REI Nation is committed to providing a personal level of customer service to investors that are looking for a company that mitigates risk while protecting investment capital.


About BiggerPockets.com

BiggerPockets.com is the nation’s largest and most active real estate investing social network, designed to simplify and enhance networking, deal-making, data evaluation, education, marketing and transactions for investors, consumers and professionals. Its mission is to help educate people in all aspects of real estate and real estate investing and to provide tools and resources to enhance real estate knowledge, networking, deal-making, and marketing. Since its founding in 2004, BiggerPockets.com has revolutionized the way people in the real estate world network.


Questionnaire and Results

REAL ESTATE INVESTOR SURVEY - WAVES 1 - 3
AUGUST 9-12/16-19/23-26, 2012

Total Interviewed: 3036

On another subject...

L1 Please tell me which of the following statements describes you the BEST.
(READ ENTIRE LIST BEFORE RECORDING ONE ANSWER)

01  You consider yourself a real estate investor and you make more than five purchases or sales a year 3%
02  You consider yourself a real estate investor and you make fewer than five investment purchases or sales a year 2%
03  You plan to become a real estate investor in the next 12 months 1%
04  You currently own an investment property with no plans to purchase more 9%
05  Or, you are not a real estate investor 87%
99 DON’T KNOW/NO RESPONSE 1%

IF CURRENTLY CONSIDER TO BE A REAL ESTATE INVESTOR, L1 (01-03), CONTINUE. ALL OTHERS SKIP TO NEXT SECTION

L2 Do you plan to purchase more, the same number or fewer properties in the NEXT 12 MONTHS than you did in the PAST 12 MONTHS?

01  MORE 39%
02  THE SAME NUMBER 26%
03  FEWER 30%
99 DON’T KNOW/NO RESPONSE 5%

L3 What factors would most affect your willingness to invest in additional properties? 
(READ LIST. RECORD AS MANY AS APPLY. WAIT FOR YES OR NO FOR EACH)
[RANDOMIZE]

Any 85%

01  Lower interest rates for investor purchases 4-5%  70% 
02  Easing of rules on Section 1031 exchanges to defer capital gains 44%
03  Additional tax incentives for capital spent to purchase, rehab or renovate investment properties 54%
04  Elimination of limits on investment property financing 46%
05  Easing of securities laws meant to limit pooling of capital by investors for purchases 30% 
95 OTHER (SPECIFY) 5%
98  NONE OF THESE 9%
99  DON’T KNOW/NO RESPONSE 5%

L4 If you are currently considering purchasing a property as an investment, how do you plan to purchase it? Would you say... (READ ENTIRE LIST BEFORE RECORDING ONE ANSWER)

01  Using 100% cash  24%
02  50% or more down in cash and finance the remainder 7%
03  20-50% down in cash and finance the remainder 44%
04  Using a Self Directed Retirement Account 7%
05  Using a 1031 Exchange 4%
95 OTHER (SPECIFY) 2%
99 DON’T KNOW/NO RESPONSE 6%

L5 How much, on average, do you intend to spend repairing and rehabilitating the next property you buy? (DO NOT READ LIST. PROBE WITH LIST IF NECESSARY. RECORD ONE ANSWER)

ANYTHING 76%

01  NOTHING 9%
02  $1 - $5,000  40%
03  $5,001 - $10,000 18%
04  $10,001 - $20,000 12%
05  $20,001 - $30,000 7%
06  $30,001 - $50,000 16%
07  MORE THAN $50,000 12%
99 DON’T KNOW/NO RESPONSE 15%

MEDAN RESPONSE: $7,500
MEAN RESPONSE$17,200

L6 How much would you be willing to put down on your investment purchases if you were able to access more financing or leverage for additional properties WITHOUT LIMITS? (DO NOT READ LIST. PROBE WITH LIST IF NECESSARY. RECORD ONE ANSWER)

01  CURRENT DOWN PAYMENT UP TO 25% 36%
02  26-29% 2%
03  30-35% 3%
04  36-39% 3%
05  40-45% 4%
06  46-49% *%
07  50% OR MORE 32%
99 DON’T KNOW/NO RESPONSE 22%


Endnotes

i Investors Retreat From Housing Market, Latest HousingPulse Results Show. Campbell/Inside Mortgage Finance HousingPulse Tracking Survey. August 28, 2012.
ii Report Reveals Potential Size of REO Rental Market in 2012 Is More Than $100 Billion Dollars. CoreLogic Releases April MarketPulse Report. April 12, 2012.
iii Single-Family Rentals Keep Pulling In Investors. Wall Street Journal. May 16, 2012.
iv Home Prices Rose in the Second Quarter of 2012 According to the S&P/Case-Shiller Home Price Indices | S&P Dow Jones Indices - HousingViews. August 28, 2012.
v Is Real Estate Still A Good Investment? From Maria Bartiromo. July 27, 2012, and
vi The IRA Investor Profile. Investment Company Institute. 2007 and 2008.
vii 2012 Investment Company Fact Book. Investment Company Institute. 2012.
viii How The Summer Squeeze is Changing Investing. BiggerPockets.com. August 29, 2012.
ix Investment and Vacation Home Sales Surge in 2011. National Association of Realtors. March 29, 2012.
x Ibid
xi Neighborhood Stabilization Program Grants. HUD.
xii What's a good loan rate? BiggerPockets.com. July 5, 2012.